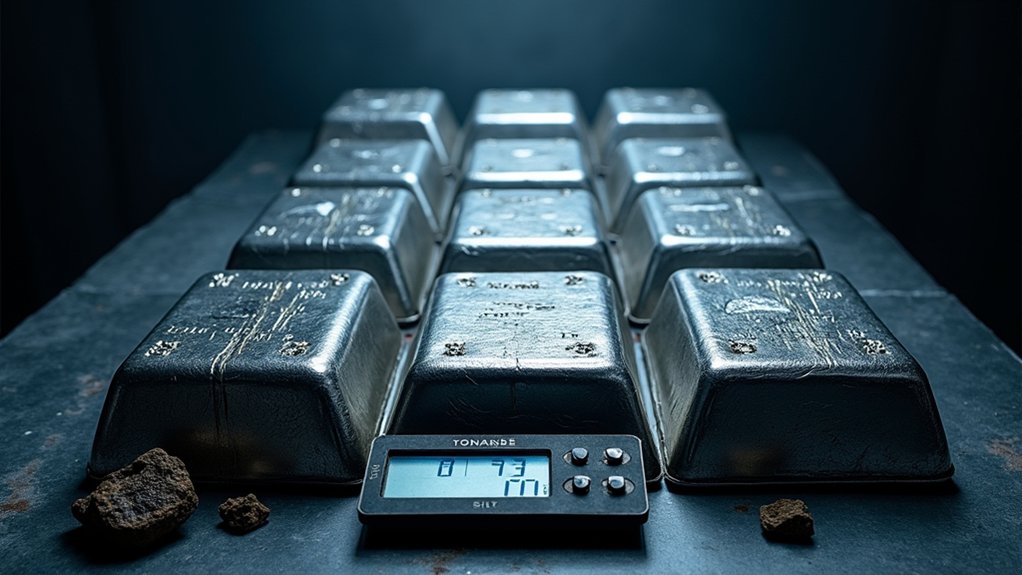

In the midst of surging prices and record-breaking rallies, silver's market structure is screaming one message: the deficit won't quit. Seven consecutive years of structural shortfalls. Nearly 800 million ounces gone since 2021. That's not a blip—that's a trend carved in stone.
Global mine production peaked around 2016 and then just… stopped growing. Meanwhile, demand exploded. Solar panels, electric vehicles, AI data centers—they all need silver, and they're not asking politely. Industrial consumption now eats over half the annual supply, and here's the kicker: that demand doesn't care if silver hits $50 or $100 per ounce. Solar energy and EV manufacturers will pay whatever it takes because substitution isn't really an option.

Supply can't catch up even if it wanted to. Over 70% of silver comes as a byproduct from copper, zinc, and lead mining. That means production is tied to base metal cycles, not silver prices. Copper demand drives the mining decisions, period. Primary silver mining struggles to fill the gap. The result? Chronic shortages baked into the system.
Inventories are scraping multi-decade lows. London and Shanghai markets show physical tightness that won't ease. Borrowing costs signal real scarcity in deliverable metal. Above-ground supplies are getting quietly drained by industrial users, investors chasing hard assets, and—here's something new—central banks starting to accumulate for reserve diversification. They bought roughly zero tonnes in 2025, sure, but the directional signal matters. This scarcity manifests in reduced market liquidity as fewer participants can easily trade physical silver without moving prices. Price volatility intensifies as emerging market currencies complicate the global settlement landscape for commodity transactions.
History rhymes with a harsh accent. The 1970s silver bull market lasted a decade because industrial demand stayed sticky. Prices quadrupled. The current setup mirrors 2010-2011, when the gold-silver ratio hit similar levels and silver rallied 206% in eighteen months. Silver hit a record $58.84 per ounce on December 1, 2025, after a 6% surge. Traders watching key price levels can identify where institutional orders cluster, signaling potential resistance zones as silver continues its climb.
Markets don't stay in deficit forever without consequences. Eventually, price discovery does its brutal work to clear the imbalance. Deficits persisted through 2022-2026 and show no signs of stopping through 2027. The world is electrifying, removing metal from circulation faster than mines can replace it. The structural deficit isn't hype. It's math.